From the pandemic recovery processes to labor shortages to tariffs, the restaurant industry has proven its resiliency in the last six years, navigating challenges to continue serving the public. Experts estimate 2025 consumer spending on prepared food and non-alcoholic beverages reached $921.7 billion, reflecting the significant impact of the industry on the overall economy. Looking ahead, projections indicate a steady growth trajectory, with consumer spending at restaurants and other foodservice establishments expected to reach $1.55 trillion in 2026. These statistics show that while challenges are never absent in any business venture, there are also great opportunities within the foodservice sector. From staffing to technology, we’ve rounded up a range of restaurant industry statistics to help operators make informed business decisions based on the current state of the industry and what they can expect going forward.
How Many Restaurants Are There in the US?

By utilizing the official federal classification known as "Food Services and Drinking Places" (NAICS 722), which encompasses restaurants and bars while emphasizing registered establishments with payroll, the total number of restaurants in the US falls within the range of approximately 720,000 to 730,000 establishments and over one million within the broader foodservice outlet category in 2026. From fast-food chains to fine dining establishments, there are many different types of restaurants across the US. Check out some facts about American restaurants.
- In 2026, there are over a million foodservice establishments in the United States.
- 60-70% of restaurants in the US are single-unit, small regional, or family-run operations.
- 9 out of 10 restaurants in the US are small businesses and have less than 50 staff members.
- As of 2026, there were 143,000 chain restaurants in the United States. Between 2021 and 2026, the chain restaurant industry experienced a compound annual growth rate of 2.2%.
Restaurant Revenue Statistics
As we look ahead to the year 2026, operators are maintaining a positive outlook, with a significant 82% anticipating improved or stabilized growth in the upcoming year. Additionally, 60% express confidence that their business will experience positive traffic in 2026. Check out these interesting restaurant sales statistics:
- Households with an income exceeding $100,000 contribute to nearly 60% of restaurant spending, while those with incomes under $50,000 account for only 20% of spending.
- In the foodservice industry, 78% of businesses generate annual revenues ranging from $100,000 to $5 million.
- Based on recent data from the USDA, around 58.5% of total food expenditure in the United States is currently designated for food consumed outside of the home, marking the highest percentage ever recorded.
- According to a 2024 study, the average American eats out five to six times a week.
- In 2025, there was a 4.1% increase in restaurant prices, which is approximately twice the rate of grocery inflation. This rise can be attributed to consistent growth in food and labor costs over the past five years, with each experiencing a 35% increase.
- In the year 2026, it is forecasted that prices for food consumed away from home are projected to increase by 3.9 percent.
- The typical American will spend more than $2,500 annually to dine out.
Restaurant Labor Statistics
Despite ongoing challenges, restaurant workers are adapting and evolving to meet changing consumer demands and operational requirements. In the year 2026, it is projected that operators will create around 100,000 new job opportunities, which will contribute to a total industry employment of 15.8 million. An increased focus on mental health in the foodservice industry is making the rigors of restaurant work more sustainable for its staff. Who are the workers who make America’s restaurant labor force? How much are they making? Check out our restaurant labor statistics to find out:
- The combined workforce of the United States restaurant and food service industry is estimated to be around 15.7 million individuals as of early 2026.
- 9 in 10 restaurant managers started in entry-level positions.
- 63% of American adults have worked in the restaurant industry.
- At 46%, there are more minority managers represented in restaurants than in any other industry.
- As of October 2025, the typical hourly wage for a restaurant worker in the United States ranges between $9.13 and $22.84 an hour.
- Between the years 2024 and 2032, projections indicate that the restaurant industry will see an annual increase of 150,000 jobs on average. By the year 2032, it is estimated that the total number of employees in the industry will reach 16.9 million.
- In 2024, bars and taverns saw an increase of 32,000 jobs, which is a 7% rise from their pre-pandemic peak. In the quick service and fast casual sectors, there were approximately 164,000 more jobs, representing a 4% increase from pre-pandemic levels.
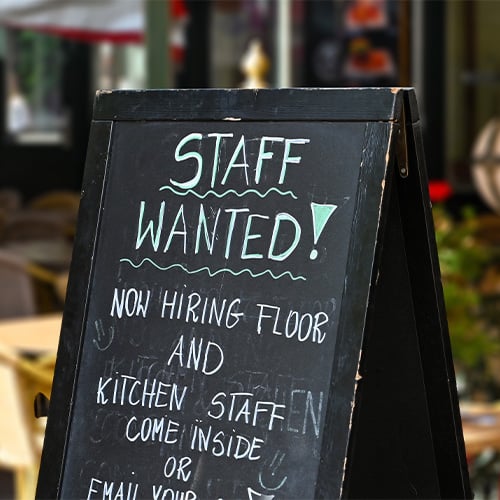
- As of 2025, 54% of restaurant operators have identified a shrinking labor pool as their primary concern when it comes to attracting and retaining talent, citing immigration reforms as a contributor to understaffing.
- 82% of businesses are currently seeking new employees. Among these positions, chefs and cooks are particularly in demand, making up 30% of the available roles.
Restaurant Takeout and Delivery Statistics
Takeout and delivery services became staples during the pandemic, with ghost kitchens being projected as ‘the new wave of foodservice’, offering a cost-effective solution for restaurants. However, the reality is more complex. Delivery apps can charge restaurants high commission fees, sometimes up to 30%. In addition, ghost kitchen operators may add rent and percentage fees on top of that. Marketing costs increase when a restaurant lacks a physical storefront. It is important to carefully consider these factors when evaluating the feasibility of operating an off-premise dining-focused business model. Use these key insights into the profitability of off-takeout and delivery profits to guide your business decisions:
- In 2025, 48% of Americans never opted for meal delivery services. Additionally, 33% of the population only ordered meals for delivery on a monthly basis or less. Only 17% of Americans chose to have meals delivered on a weekly basis or more frequently.
- Ghost kitchens had a 58% failure rate within their first year, compared to just 0.9% of traditional restaurants that closed in 2025 (the lowest first-year closure rate since 2018).
- 34% of Americans spend an average of $50 on online food orders.
- Approximately 50% of consumers view takeout or drive-thru meals as a crucial aspect of their lifestyle. In comparison, 67% of Gen Z adults resonate with this viewpoint. Conversely, 41% of the surveyed individuals share a similar sentiment regarding delivery services.
- In the year 2025, a significant 75% of restaurant traffic currently consisted of takeout orders. Speed and convenience heavily influenced consumer preferences.
- Speed is considered a crucial factor in the takeout experience by 95% of polled consumers.
- Friday is the most popular day of the week to order food online, and Saturday is the second most popular day.
- French fries hold the top spot as the most popular food item ordered online in the United States. They are closely followed by chicken quesadillas and mozzarella sticks.
Restaurant Technology Statistics

In our digital age, technology defines how people find and interact with restaurants. It's no longer just about designing an excellent website. Social media affects how customers find and view your business, technology preferences are shifting, and AI is transforming how businesses operate. Use these restaurant technology statistics to understand how to leverage technological advancements and consumer preferences with technology usage to your advantage.
- Based on a 2025 survey, labor efficiency, training, and scheduling were identified as the primary areas where Artificial Intelligence (AI) could be beneficial, accounting for 40% of responses. Following closely behind were customer data analysis and trend predictions at 34%, and customer experience/personalization at 28%.
- QR code menu use has risen from 42% in 2022 to 65% in 2025. However, fewer people find the overall digital menu experience enjoyable, with only 39% express a desire for the ongoing presence of QR code menus. Consumers are now expressing a preference for traditional paper menus, with 58% indicating a desire to return to them.
- Approximately 60% of millennials and Gen Z adults have expressed interest in utilizing AI-generated bots for placing orders. Additionally, a significant number of Gen Z adults have shown openness to the idea of receiving food deliveries through robots or drones.
- In the quick-service restaurant industry, a significant 88% of participants acknowledged that transitioning to TV menu boards positively influenced customer experience and satisfaction. Additionally, an impressive 91% reported that adopting digital menu boards assisted in boosting sales by as much as 10%.
- 94% of U.S. restaurateurs monitor online reviews and social media engagement to manage their public image.
- 90% of consumers engage in online research about restaurants, and 72% of these consumers use social media platforms to gather information.
- 74% of consumers are now utilizing social media platforms as a primary source for deciding where to dine.
- One in every 10 restaurants opts to enlist the services of a third-party company to manage their social media interactions.
- 56% of consumers choose to patronize businesses that actively engage with and respond to reviews provided by customers.
- 71% of consumers are more likely to recommend a restaurant that has a convenient ordering system and will respond promptly on social media.
- 53% of TikTok users visit a restaurant after discovering its menu options on the social media platform.
- 38% of Instagram users browse food content, and 27% will share food content.
- 82% of small and medium-sized businesses use Facebook to engage with their customers.
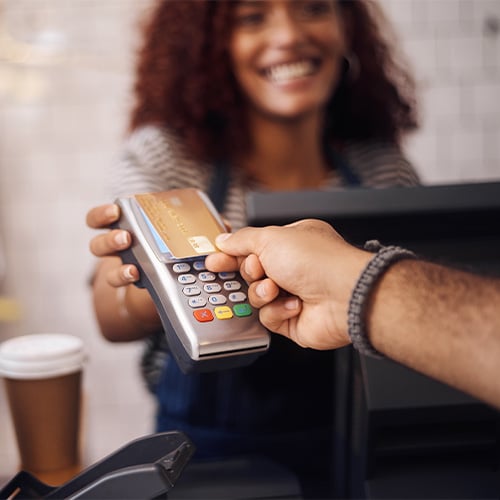
- Based on a study conducted in 2025, 53% of US consumers generally and 65% of Gen Z respondents prefer contactless payment methods when making purchases in physical stores.
Knowing restaurant industry statistics can be the key to success in the competitive foodservice market. By understanding the trends and patterns that shape the industry, restaurant owners and operators can leverage opportunities and avoid potential pitfalls. Restaurant industry statistics can also help businesses make informed decisions about expansion and growth.
- Catering Foodservice & Events
- CKitchen
- DATASSENTIAL
- Door Dash
- Escoffier
- Expert Market
- Food & Wine
- Forbes
- IPSOS
- LightSpeed
- Marketing Dive
- Menu Tiger
- MINNPOST
- Morning Star News
- National Restaurant Association
- Nation's Restaurant News
- NY Post
- Restaurant Drive
- Restaurant 101
- Restaurant Business
- Restaurant Dive (1)
- Restaurant Dive (2)
- ToastTab
- USDA (1)
- USDA (2)
- YouGov
- ZipRecruiter

Corrinn loves writing, researching, and cooking, so she’s grateful she’s gotten to blend these three passions as a longform writer on the content team at WebstaurantStore for 5 years and counting. Creating resources that help operators succeed and lacing them with entertainment to make them smile is her "why".
Learn more about this author and WebstaurantStore's Content Writing Team here!